Most deals that slip do not slip suddenly. They send signals for weeks before anyone admits the close date is fiction. The rep goes quiet, the close date moves, the next step field stays blank, and the forecast call still hears "we're on track."
The good news is that almost every one of those signals is already sitting in Salesforce. You do not need conversation intelligence, email scraping, or a predictive model to see most of them. You need to know which fields to look at, and you need to look at them on every deal, not just the ones someone remembers to ask about.
This guide covers the ten deal risk signals we see matter most in B2B Salesforce orgs, where each one lives in your data, and how to turn them into something a sales manager can act on.
What is a deal risk signal?
A deal risk signal is an observable change or gap in an opportunity's data that historically comes before a deal stalls, slips, or is lost. One signal on its own is rarely decisive. A deal with no activity for ten days might just be waiting on legal. The value comes from combinations: no activity, plus a pushed close date, plus a blank next step is a very different deal from any one of those alone.
That is the core idea behind deal risk intelligence: score every open opportunity from the signals it is showing, consistently, instead of relying on how confident the rep sounds.
The 10 deal risk signals worth tracking
1. Days since last activity
The single most reliable early warning. When nobody has logged a completed task or event on a deal for two or three weeks, the deal is usually not progressing, whatever the stage says.
Where it lives: the standard LastActivityDate field on Opportunity. Compare it to today and set a threshold that matches your sales cycle. Seven days is alarming in a 30-day cycle and normal in a 9-month one.
2. No future scheduled activity
A deal with nothing on the calendar has no forward motion. This catches a different problem from signal 1: a rep can have logged a call yesterday and still have no next meeting booked.
Where it lives: open Tasks and Events related to the opportunity with a due date of today or later. If the count is zero, the deal is drifting.
3. Close date pushes
One push is normal. Two is a pattern. Three usually means the close date is a placeholder rather than a commitment from the buyer.
Where it lives: Salesforce records close date changes in OpportunityHistory automatically, so you can count how many times the date has moved later. Field History Tracking on Close Date gives you the same thing with more detail.
4. Stage regression
A deal moving backward, from Negotiation back to Proposal for example, almost always means something broke: a new stakeholder, a budget review, or a competitor re-entering.
Where it lives: also in OpportunityHistory. Compare each stage change with the stage before it, using your stage order or probability.
5. Stage stagnation
Deals that sit in one stage far longer than your typical deal does are at risk even when everything else looks fine. The reference point is your own data: how long do deals that eventually close usually spend in this stage?
Where it lives: the standard LastStageChangeDate field, or your own stage history. Measure days in the current stage against the typical duration for that stage.
6. Blank next step
If the rep cannot write down the next step, there often is not one. This is a small field with an outsized signal, and it is free to check.
Where it lives: the standard NextStep field. Blank, or unchanged for weeks, both count.
7. Opportunity age
Deals that have been open far longer than your average winning deal convert at much lower rates. Old deals tend to inflate pipeline coverage and make the forecast look safer than it is.
Where it lives: CreatedDate compared with today, benchmarked against the typical age of your closed-won deals.
8. Amount erosion
A shrinking deal is often a deal being rescued: scope cut to fit a budget, seats reduced, a multi-year term dropped to one year. Sometimes that is healthy. Often it is the first step toward losing it.
Where it lives: OpportunityHistory again, which records amount changes. Flag deals where the amount has dropped meaningfully from its peak.
9. Open high-priority cases
For expansion and renewal deals, an unresolved high-priority support case on the account is one of the clearest risk signals there is. Buyers do not sign a bigger contract while something important is broken.
Where it lives: open Cases on the opportunity's Account with a high priority. This only works if Service and Sales share the same org, which is one more reason to keep them together.
10. Thin or disengaged contacts
A deal with one contact is a deal with one point of failure. Single-threaded deals are fragile: if your champion changes jobs or goes quiet, there is no one else to talk to.
Where it lives: Opportunity Contact Roles. Count how many contacts are attached, and how many have had any activity recently.
Why one signal is not enough
If you build a report for each signal above, you will get ten lists and a sales team that ignores all of them. The useful view combines them:
- High risk: no activity for 14+ days, and the close date pushed twice, and no next step.
- Watch: stagnating in stage, but recent activity and a booked meeting.
- Healthy: activity this week, future meeting scheduled, close date unchanged.
The exact rules matter less than two properties. They have to be consistent, applied to every open deal the same way, not just the ones a manager remembers to ask about. And they have to be explainable: when a deal is flagged, the rep should see exactly which signals fired. A risk score nobody can explain gets ignored within a month.
How to start tracking deal risk signals in Salesforce
You can do a useful version of this with standard Salesforce in an afternoon:
- Start with three signals: days since last activity, close date pushes, and blank next step. They need no setup and catch most slipping deals.
- Build one report of open opportunities closing this quarter, with those three fields as columns, sorted by days since last activity.
- Review it weekly in the pipeline meeting, deal by deal, before the forecast discussion.
- Add stage history signals once the habit sticks: regression, stagnation and amount erosion from
OpportunityHistory.
The limits show up quickly. Reports cannot easily combine signals into a single score, count close date pushes per deal, or compare stage duration with your own historical norms. That is the gap tools in this category fill. We compared the main approaches, including native apps, rep questionnaires, and sync-out platforms like Clari, in our guide to Salesforce deal risk apps.
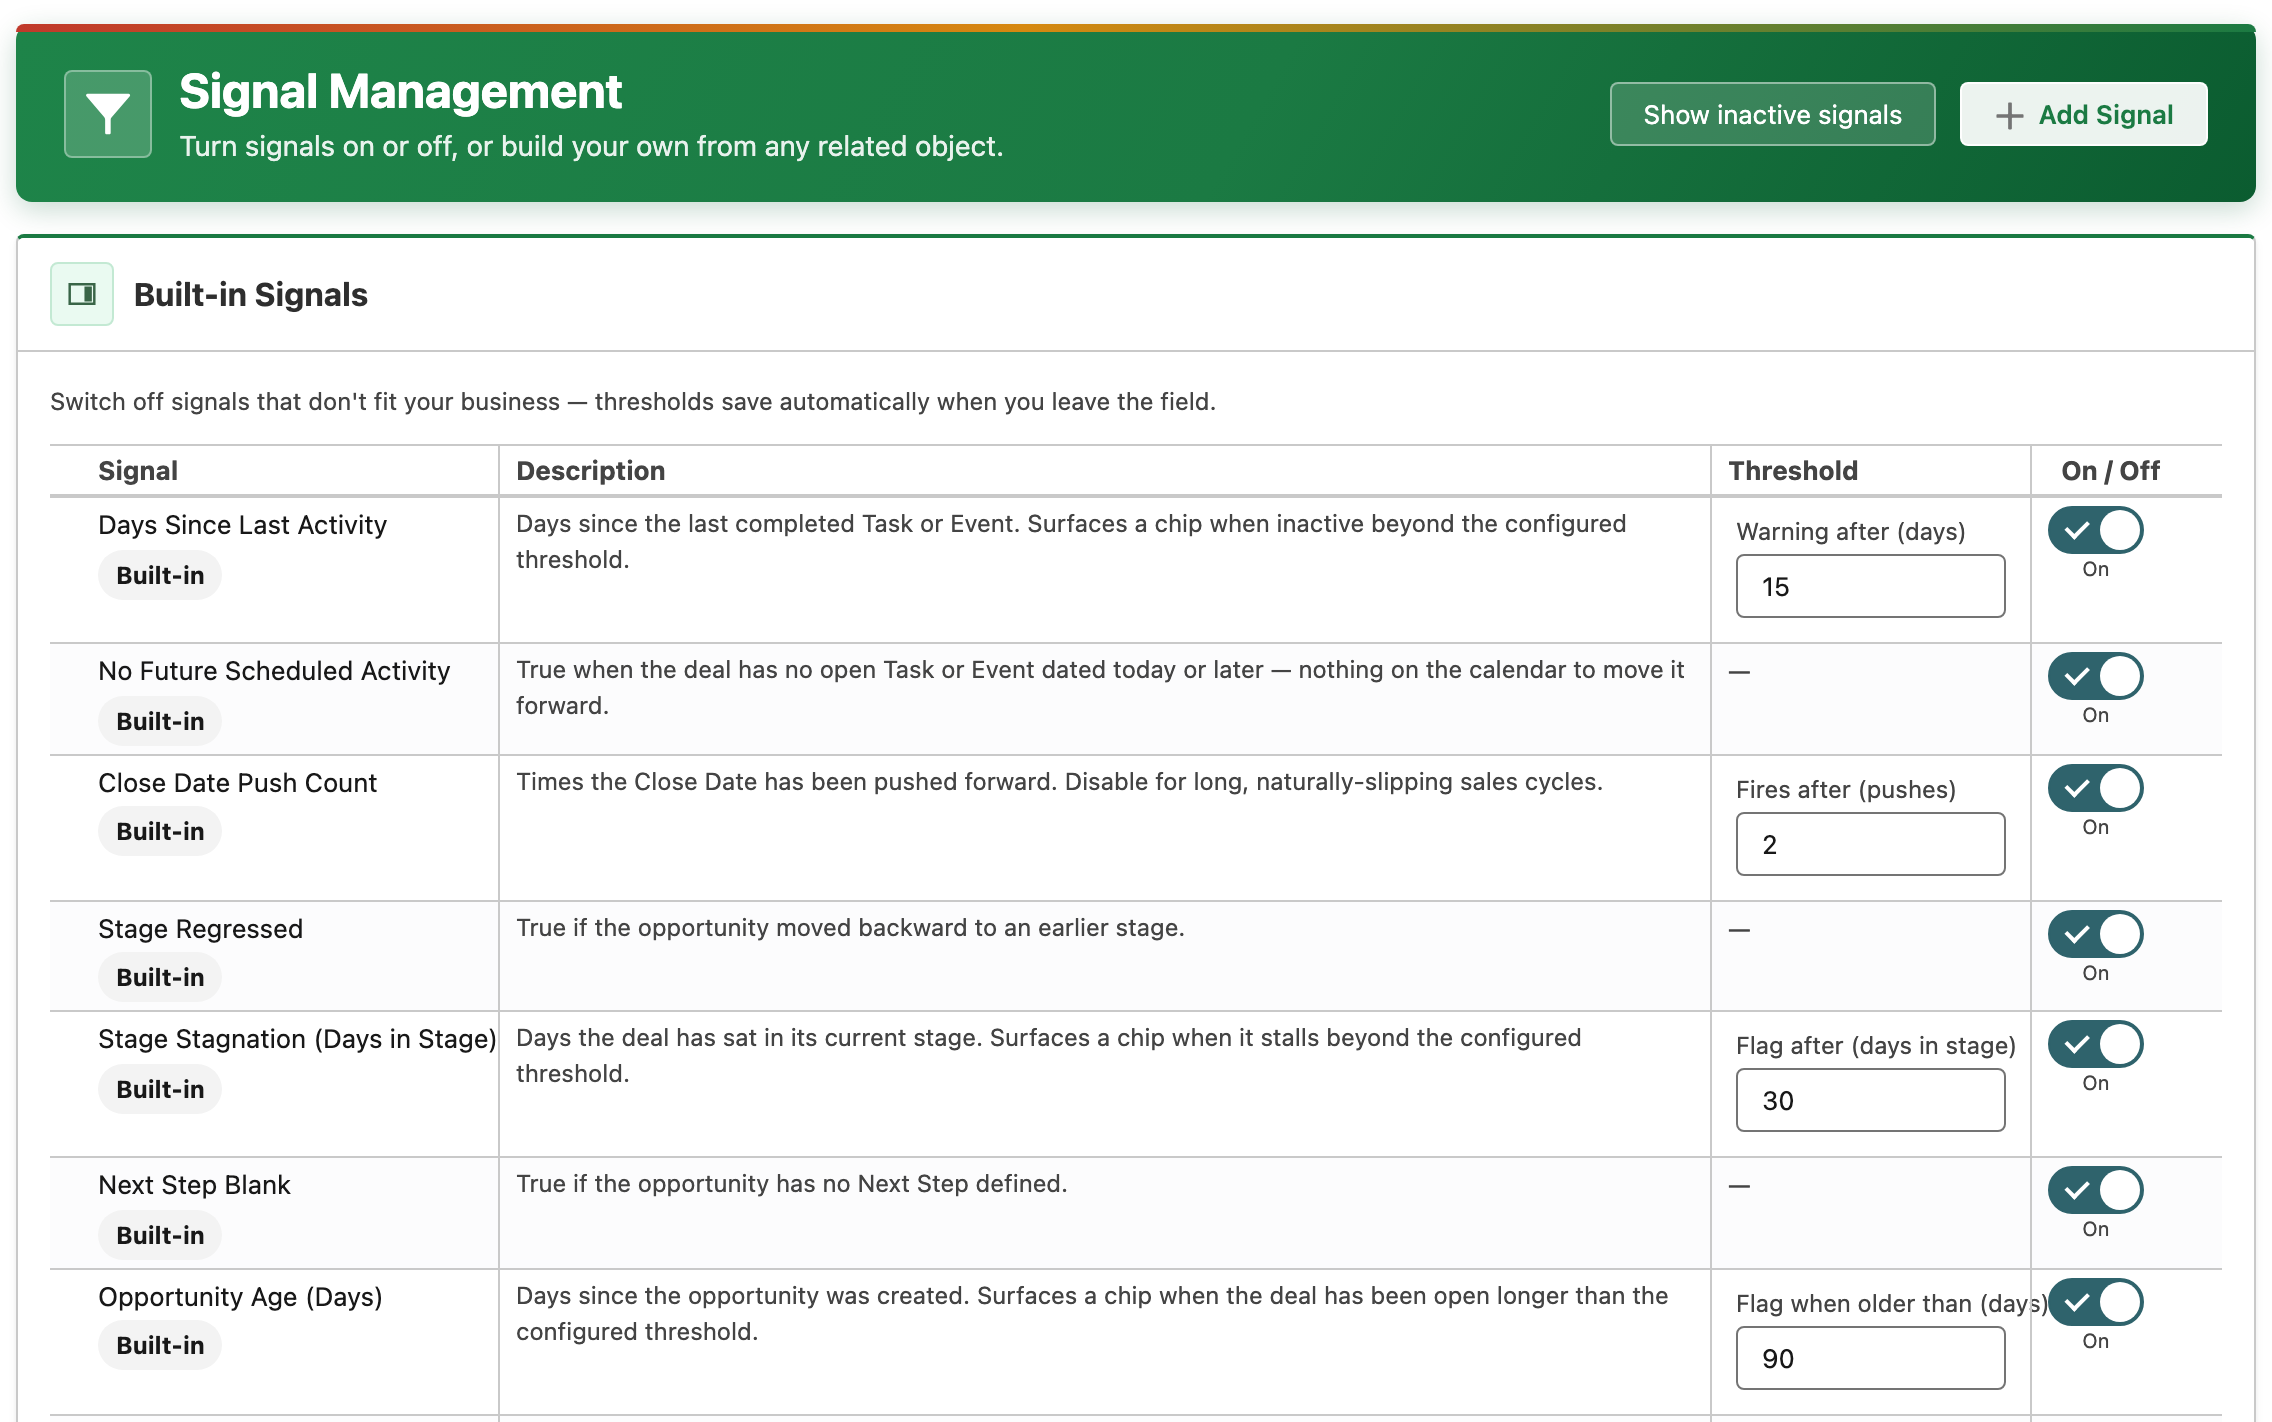
DealPulse, our own app, tracks signals 1 to 7 above out of the box. Signals 8 to 10 can be switched on per org, and you can add your own custom signals without code. It runs 100% natively inside Salesforce, and every risk score traces back to the exact signals that fired. If you want definitions for any of the terms here, see the deal risk glossary.
Frequently asked questions
What are deal risk signals?
Deal risk signals are observable changes or gaps in an opportunity's data, such as no recent activity, a pushed close date, or a blank next step, that historically come before a deal stalls, slips, or is lost. They are most useful in combination rather than one at a time.
Which deal risk signal is the most reliable?
Days since last activity is usually the strongest single early warning, because a deal nobody is working is rarely progressing. It is most reliable when combined with close date pushes and a missing next step.
Can I track deal risk signals in Salesforce without extra tools?
Yes. Most signals come from standard fields such as LastActivityDate, NextStep, CreatedDate and LastStageChangeDate, plus the OpportunityHistory object, so you can build reports for them with standard Salesforce. What reports cannot easily do is combine several signals into one consistent, explainable risk score for every deal.
How is a deal risk signal different from a deal score?
A signal is one observation, such as "close date pushed twice". A deal risk score combines several signals into an overall rating for the opportunity. Good scores stay explainable by showing which signals produced them.